
Spot Bitcoin ETFs have shed roughly $2 billion in assets over the past two weeks, extending a redemption streak that has now matched the longest in the products’ 18-month history and reignited debate over the durability of institutional crypto demand. The data, drawn from Farside Investors and confirmed by Bloomberg, marks the most concentrated institutional exit from US-listed Bitcoin ETFs since the August 2024 carry-trade unwind, and comes even as Bitcoin’s spot price has held above $60,000. The Bitcoin ETF outflows suggest that the buyers who piled in during the late-2024 rally are no longer the marginal price-setters.
Two Weeks, $2 Billion: What the Numbers Show
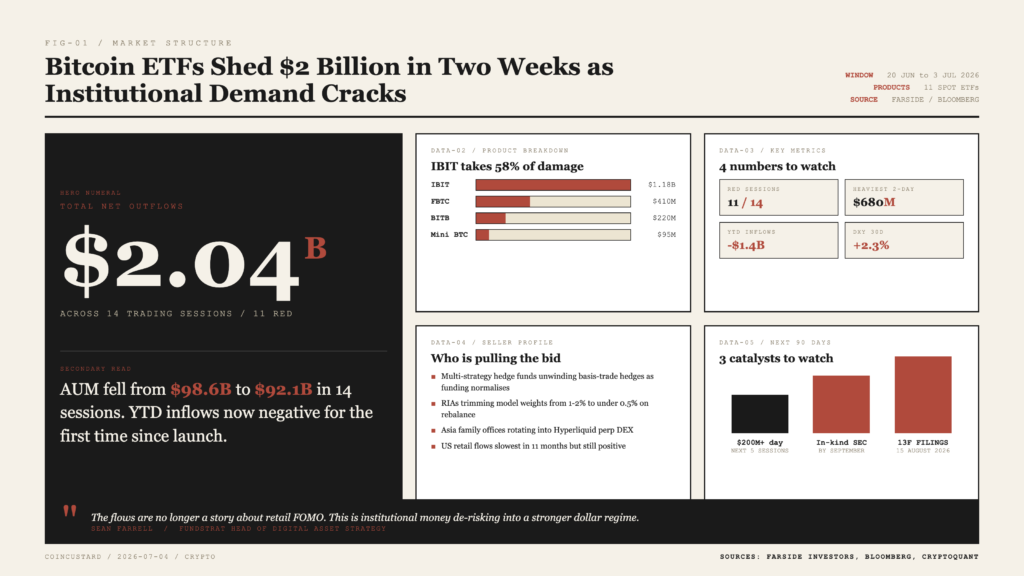
Between 20 June and 3 July 2026, US spot Bitcoin ETFs recorded net outflows on 11 of 14 trading sessions, totalling an estimated $2.04 billion. BlackRock’s IBIT, the largest product with roughly $42 billion in assets, accounted for $1.18 billion of the withdrawals, or about 58% of the total. Fidelity’s FBTC shed $410 million, Bitwise’s BITB lost $220 million, and the Grayscale mini-fund trimmed $95 million. The redemption pace accelerated on Thursday and Friday of last week when combined outflows exceeded $680 million across the complex, the heaviest two-day stretch since launch.
Total assets under management for the 11-product complex fell from $98.6 billion at the start of June to $92.1 billion by 3 July. Even with the price action, the AUM decline is striking. Net inflows year-to-date are now negative for the first time since the ETFs debuted, down approximately $1.4 billion for 2026 after positive flows of $36 billion in 2024 and $14 billion in 2025.
Who’s Selling and Why
- Multi-strategy hedge funds that used IBIT as a basis-trade hedge appear to be unwinding positions as funding rates normalise.
- Several registered investment advisors have trimmed Bitcoin ETF allocations from 1-2% model weights to under 0.5%, citing portfolio rebalancing rather than bearishness.
- Family offices in Asia, particularly Singapore and Hong Kong, have rotated a portion of crypto exposure into the Hyperliquid ecosystem, where perp DEX volumes now exceed Coinbase’s.
- Retail brokerage flows remain positive but at the slowest pace in 11 months, suggesting the marginal buyer is no longer a US household.
“The flows are no longer a story about retail FOMO. This is institutional money de-risking into a stronger dollar regime.” Sean Farrell, Fundstrat head of digital asset strategy
The Macro Backdrop Behind the Bitcoin ETF Outflows
The exit coincides with two macro shifts. First, a string of stronger-than-expected US jobs reports has pushed the median Federal Reserve dot-plot expectation for end-2026 to just one additional 25-basis-point cut, down from three in March. Higher-for-longer real rates are a headwind for non-yielding assets, and Bitcoin’s correlation to the 10-year real yield has tightened to -0.61 over the past quarter. Second, the Bloomberg Dollar Index has appreciated 2.3% since mid-June, draining dollar liquidity from risk assets globally.
On-chain data adds another layer. CryptoQuant’s Coinbase Premium Index, which tracks the spread between Coinbase and offshore prices, has flipped negative on 9 of the past 14 days, a pattern last observed in February 2025 ahead of a six-week consolidation. Exchange balances for Bitcoin have declined only marginally, suggesting the selling is ETF-driven rather than spot-driven. That distinction matters: ETF redemptions are settled in cash, meaning the authorised participants must sell Bitcoin to meet redemptions, putting mechanical downward pressure on price that is independent of underlying demand.
What to Watch Through the Second Half of 2026
Three signals will determine whether the Bitcoin ETF outflows become a rout or a reset. First, the next 5 trading sessions: a single day of inflows above $200 million would break the streak and likely cap further AUM erosion. Second, the SEC’s pending decision on in-kind creations and redemptions, expected by September, which would lower frictions and could revive institutional appetite. Third, the Q2 13F filings due 15 August, which will reveal whether the current sellers are closing positions or rotating into other vehicles such as ETH ETFs, Solana ETFs, or private credit structures with crypto exposure.
There is also a longer-running question hanging over the data. The original spot Bitcoin ETF thesis, articulated by BlackRock CEO Larry Fink and others in 2023, was that the products would bring a durable, sticky pool of institutional capital into the asset class. The first 18 months delivered on that promise. The current two-week stretch is the first sustained test of how durable the bid actually is when rates move against the trade. So far, the answer is mixed. Long-term holders, those who bought before the 2024 halving, have not meaningfully distributed, with on-chain data showing realised-profit-taking at less than 40% of the 2024 peaks. The marginal seller, however, is now the same institutional allocator who defined the marginal buyer for most of 2024 and 2025. The structural story of Bitcoin ETF outflows is being written in real time, and the next 30 days will do most of the writing. The flow data is concerning, but the broader adoption arc is not over. It is being repriced.