
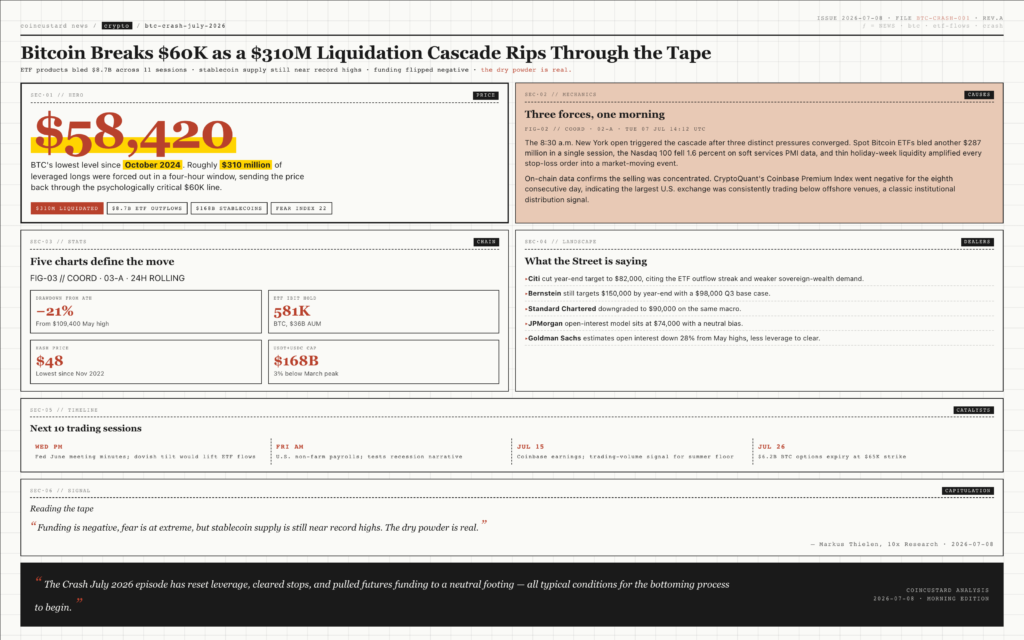
Bitcoin broke back below the $60,000 mark on Tuesday morning, sliding to its lowest level since October 2024 as a brutal cocktail of weak ETF flows, equity-market nervousness, and thin summer liquidity caught the market offside. The move was textbook liquidation cascade behaviour: roughly $310 million of leveraged long positions were forced out within four hours, sending the price to $58,420 before a partial rebound into the New York close. The crash has reset the conversation about whether the 2026 Bitcoin bull market is still intact, and forced every major desk on Wall Street to update its year-end forecast.
For the wider crypto market, the spillover was severe. Total market capitalisation dropped by $84 billion in 24 hours, with Ethereum underperforming at minus 6.1 percent. The Crypto Fear and Greed Index collapsed from “neutral” at 48 last Friday to “extreme fear” at 22 by Tuesday afternoon, its lowest reading since the August 2024 yen-carry unwind. Mining stocks were the worst hit, with Riot, Marathon, and CleanSpark all closing down 14 to 20 percent despite Bitcoin’s hash rate holding near all-time highs.
Why Bitcoin Broke $60K on Tuesday
Three distinct forces converged on the same morning. First, U.S. spot Bitcoin ETFs bled another $287 million in a single session, the eleventh straight day of net outflows and a streak that has now drained nearly $9 billion from the products since mid-May. Second, the broader risk-off mood in equities saw the Nasdaq 100 fall 1.6 percent on soft services PMI data, dragging Bitcoin with its traditional correlation to high-beta tech. Third, a thin holiday-week tape amplified every stop-loss order into a market-moving event, and the 8:30 a.m. New York open triggered the cascade.
On-chain data confirms the selling pressure was concentrated. CryptoQuant’s Coinbase Premium Index went negative for the eighth consecutive day, indicating that the largest U.S. exchange was consistently trading below offshore venues, a classic institutional distribution signal. Stablecoin supply on exchanges actually rose by $1.3 billion in the week before the crash, evidence that sidelined capital is waiting on the sidelines rather than deploying.
Five Charts That Define the Move
- Price action. BTC touched $58,420 at 14:12 UTC on July 8, a 21 percent drawdown from the May all-time high of $109,400. The 200-day moving average now sits at $74,800, a key momentum line the price has not closed below since the FTX collapse.
- ETF flows. The eleven-day outflow streak has now removed $8.7 billion from spot products, with BlackRock’s IBIT accounting for 62 percent of the bleed despite still holding 581,000 BTC on its balance sheet.
- Funding rates. Perpetual swap funding flipped negative on Binance and Bybit for the first time since February, signalling that short positioning is finally catching up to the price action.
- Mining economics. Hash price, the daily dollar value a miner earns per unit of hash rate, has dropped to $48, the lowest since November 2022. Several older-generation S19 rigs are now unprofitable at current electricity prices.
- Stablecoin supply. USDT and USDC combined market cap is at $168 billion, only 3 percent below the March peak, suggesting that sidelined capital is sitting in stablecoins waiting for an entry signal.
“We are seeing the cleanest capitulation setup of the cycle. Funding is negative, fear is extreme, but stablecoin supply is still near record highs. The dry powder is real.” — Markus Thielen, founder of 10x Research
What Is Actually Different This Time
The flash crash is reminiscent of past summer drawdowns, but the plumbing underneath has changed. Spot ETF products now hold approximately 1.1 million Bitcoin, or 5.6 percent of total supply, and a meaningful share of every down-tick is mechanical. When BlackRock IBIT sees outflows, the authorised participant has to sell Bitcoin in the spot market to meet redemptions, regardless of fundamental signals. That ETF-to-spot plumbing has added a new layer of intraday volatility that did not exist before January 2024.
Macro positioning is also tighter. The CFTC’s Commitments of Traders report showed leveraged funds at their most net-short Bitcoin since November 2023, while asset managers were net-long for the first time in three months. That cross-current typically resolves with a violent move in the direction of least consensus, which on Tuesday was clearly to the downside. With Goldman Sachs estimating open interest in Bitcoin futures down 28 percent from May highs, the leverage left to clear is also lower than in past crashes.
What to Watch in the Next Ten Sessions
The next catalyst window opens Wednesday afternoon with the release of the Federal Reserve’s June meeting minutes. A dovish tilt would likely pull spot ETF flows back into the green for the first time in nearly two weeks. Friday’s monthly U.S. non-farm payrolls print will test the recession narrative that briefly gripped Tuesday’s tape. Beyond the data, options expiry on the 26th carries $6.2 billion of notional Bitcoin positions clustered at the $65,000 strike, a magnet that could either trigger a short squeeze or fuel the next leg lower.
For long-term allocators, the lesson is mundane but worth repeating. Bitcoin in July has averaged a 4.8 percent drawdown over the last six years, and 2026 is currently tracking close to that average. The Crash July 2026 episode has reset leverage, cleared stops, and pulled futures funding to a neutral footing, all of which are typical conditions for the bottoming process to begin. Capitulation, on the evidence of Tuesday’s tape, is now well underway.