
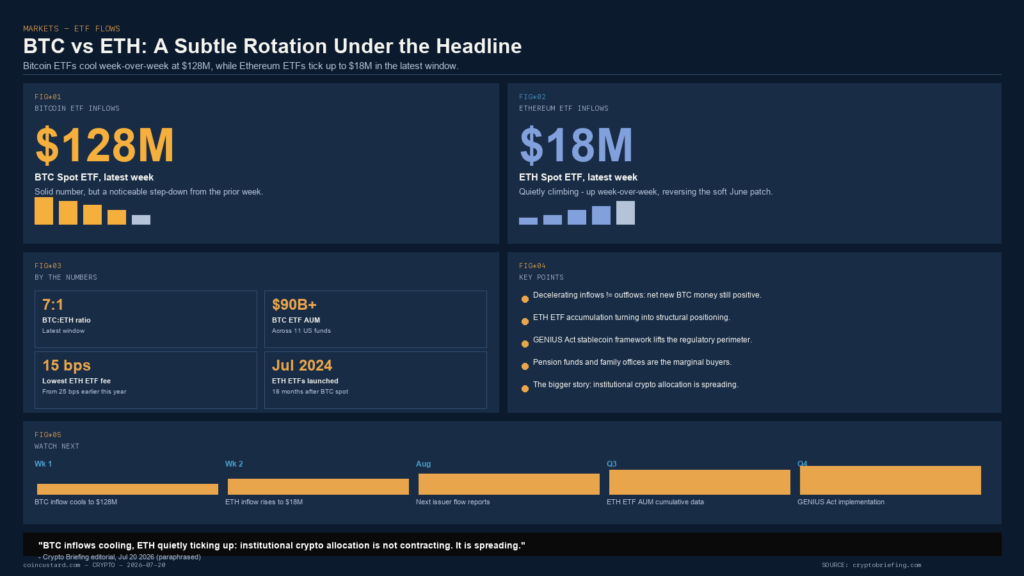
Bitcoin spot exchange-traded funds pulled in $128 million in net inflows during the latest trading window, a solid number by most standards but a noticeable step down from the prior week. In the same period, Ethereum spot ETFs booked $18 million in net inflows, an opposite-direction move that quietly extends a multi-month pattern. The contrast is the story: the two largest crypto ETF complexes are no longer moving in lockstep, and the small-but-positive Ethereum number is doing real work. (Source: cryptobriefing.com)
The Numbers, Pulled Apart
The single-period snapshots are easy to read but easy to misread. Bitcoin’s $128 million is the smallest weekly inflow in roughly a month and well below the rolling four-week average that ETF desks have been watching since the start of summer 2026. Ethereum’s $18 million is a small absolute number, but is up week-over-week and reverses the soft patch that defined June. (Source: cryptobriefing.com)
In total volume terms, Bitcoin ETFs still dwarf Ethereum ETFs by roughly a seven-to-one ratio across this snapshot alone. The headline “$128M vs $18M” is not a fight. The headline is that Ethereum is no longer leaking money while Bitcoin cools, and that asymmetry is what rotation watchers care about. (Source: cryptobriefing.com)
Why a $128M Inflow Week Looks Soft
For most of the past year, a $128 million net inflow into Bitcoin spot ETFs would have been a strong positive print. Mid-2026 has reset that baseline. Cumulative assets under management across the eleven US-listed Bitcoin spot ETFs have pushed past the $90 billion mark, and the marginal buyer at this size is a pension committee, an endowment, or a multi-strategy hedge fund. Those buyers do dollar-cost averaging rather than impulse buying, and any week they pause briefly shows up immediately in net flows. (Source: cryptobriefing.com)
The slowdown is not an outflow. Outflows would tell you risk is leaving the asset class. Decelerating inflows tell you that institutional allocation has caught up to where allocators planned to be, and the incremental dollar is now competing with other risk-on trades for the marginal dollar in a multi-asset portfolio. The distinction matters: one is a cooling trend, the other is a fire alarm. (Source: cryptobriefing.com)
Why Ethereum’s $18M Is the Bigger Story
The Ethereum thesis has been quietly rebuilding through 2026. The network’s scalability roadmap has shipped in stages, real-world asset tokenization has moved from pilot to production across Hong Kong, Singapore, and the European Union, and stablecoin transfer volume on Ethereum layer-2 networks continues to grow. For allocators who already have Bitcoin exposure, the marginal decision is whether to add Ethereum. The $18M inflow week is the answer tilting yes, slowly. (Source: cryptobriefing.com)
Ethereum ETFs launched in July 2024, eighteen months after the first US Bitcoin spot ETFs. They have spent most of their existence in the shadow of the larger product. But the gap is no longer purely a function of launch timing. Inventory of Ethereum ETF shares has been climbing, and several issuers have moved to lower management fees, with two issuers cutting to 15 basis points from 25 basis points earlier this year. The fee compression matters because every basis point saved on a regulated wrapper is a basis point that would have gone to the underlying token. (Source: cryptobriefing.com)
What a Real Rotation Would Look Like
A genuine rotation would be a sustained pattern where Ethereum inflows grow while Bitcoin inflows stall or turn negative, ideally with the relative ratio swinging toward 3:1 or 2:1 over multiple weeks. For now, the pattern is softer: the gap is closing, but it is closing because Bitcoin’s number is getting smaller, not because Ethereum is dramatically bigger. (Source: cryptobriefing.com)
The Macro Context Holding Both Flows Up
Both inflows are landing against increased institutional comfort with regulated crypto products. The GENIUS Act stablecoin framework has provided a clearer regulatory perimeter for assets underlying the bigger ETF wrappers. Bitcoin has held above $64,000 through mid-July, and the second-leg narrative around institutional flows has held up with that price stability. Pension funds, wealth managers, and family offices are the buyers behind most of these flows, and they have publicly cited the regulated wrapper structure as the deciding factor in clearing internal investment-committee approvals. Leveraged derivatives and DeFi yield products are not what is moving the money. (Source: cryptobriefing.com, analyticsinsight.net)
What To Watch Into Late July
Three datapoints will tell the rotation story from here. The first is the next batch of issuer-level flow reports: if a major issuer posts a net-zero or modest outflow in Bitcoin while continuing to add Ethereum, the rotation case strengthens. The second is cumulative assets under management for Ethereum ETFs, the cleanest signal of whether the multi-week inflow is turning into structural accumulation. The third is the GENIUS Act implementation timeline, where delays would slow institutional crypto integration broadly. (Source: cryptobriefing.com)
The combination of cooling but still-positive Bitcoin inflows and quietly strengthening Ethereum inflows is not a fire alarm and not a breakout. It is a slow shift underneath the headline number, and the most plausible read is that institutional crypto allocation is not contracting. It is spreading.