
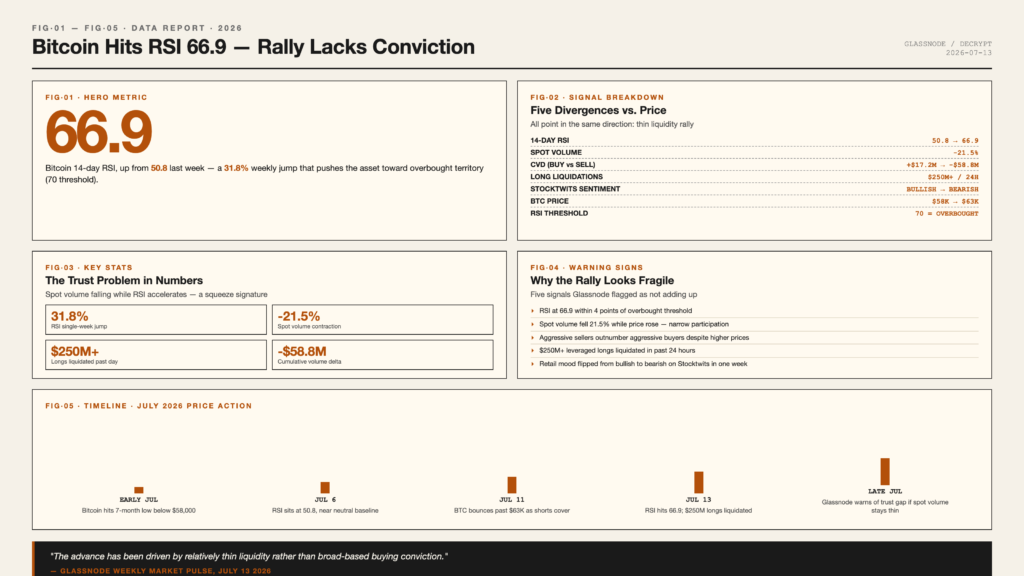
Bitcoin’s two-week Relative Strength Index has jumped 31.8 percent in a single week, pushing the asset into overbought territory even as on-chain data shows the rally is running on thin liquidity. Glassnode’s latest Weekly Market Pulse report warns that aggressive sellers now outnumber aggressive buyers despite higher prices, a divergence that has historically preceded sharp corrections in both directions.
Bitcoin was struggling to hold onto 63,000 dollars on Monday morning, with retail sentiment on Stocktwits flipping from bullish to bearish within a single week. The price bounce off a seven-month low below 58,000 dollars earlier this month has been aggressive, but the underlying tape tells a less convincing story about whether the move has staying power or is simply a relief bounce off oversold conditions.
The Numbers Behind the Rally
Glassnode’s analytics team highlighted four metrics that together suggest the advance lacks broad participation. The 14-day RSI rose from 50.8 to 66.9, a 31.8 percent weekly move that places Bitcoin in overbought territory by traditional technical standards. Spot trading volume, by contrast, contracted 21.5 percent over the same window, falling from 5.2 billion dollars to 4.1 billion dollars.
Spot cumulative volume delta, a measure of net aggressive buying versus selling, flipped from a positive 17.2 million dollars to a negative 58.8 million dollars. The shift means aggressive sellers outnumber aggressive buyers even as the price climbs, the opposite of what a healthy breakout looks like on a sustained basis.
Over 250 Million Dollars in Longs Liquidated
The leverage flush has already started. More than 250 million dollars in leveraged crypto positions were liquidated over the past day, with long positions accounting for the majority of the losses. Liquidations of this size in a single 24-hour window typically indicate overcrowded positioning on one side of the market, and they tend to be followed by either a violent continuation move or a sharp mean-reversion as late longs are flushed out and forced buyers emerge at lower levels.
The combination of rising price, falling spot volume, negative cumulative volume delta, and aggressive long liquidations is the kind of pattern Glassnode analysts flag when they want to highlight a rally that is being driven by relatively thin liquidity rather than broad-based buying conviction from long-term holders and institutional allocators.
“The advance has been driven by relatively thin liquidity rather than broad-based buying conviction.” – Glassnode Weekly Market Pulse
What the RSI Is Signaling
The 14-day RSI is one of the most widely watched technical indicators in crypto, and a reading above 70 is the traditional threshold for overbought conditions. At 66.9, Bitcoin is approaching that threshold but has not yet crossed it, leaving room for either a continued push higher or a rejection at resistance. The 31.8 percent single-week jump is the more unusual reading, since RSI typically moves in small increments during healthy trends.
A 31.8 percent weekly RSI increase from a base near the midline often reflects a sharp short squeeze or a forced repositioning event rather than a steady accumulation phase. Glassnode’s volume data supports the squeeze interpretation, since spot volume is declining while RSI accelerates, a combination that rarely produces durable new highs without a corrective reset first.
Trust Versus Price Action
Glassnode’s trust problem framing captures the gap between market price and underlying conviction. Trust, in this context, refers to the breadth and depth of buyers willing to step in at current levels. A rally built on liquidations, declining spot volume, and aggressive sellers outpacing aggressive buyers does not inspire deep trust in the durability of the move because the marginal buyer is forced rather than enthusiastic.
The retail sentiment flip on Stocktwits reinforces the picture. When the crowd mood shifts from bullish to bearish in a single week while price barely moves, it typically means early buyers are taking profits while new buyers are reluctant to chase. This is consistent with a market that has rallied enough to disappoint remaining bears but not enough to attract fresh structural demand from funds and long-term allocators waiting for confirmation.
Historical Pattern for Similar Setups
Bitcoin has printed RSI readings above 65 after sharp single-week rises several times in the past four years, and the typical follow-through has been a 5 to 12 percent pullback within the next two to three weeks. Not every such setup produces a deeper correction, but the combination of negative cumulative volume delta and declining spot volume has historically been a more reliable warning than the RSI reading alone.
Traders watching the Glassnode data will be focused on whether cumulative volume delta can flip back to positive, which would signal that aggressive buyers have re-entered. Until that shift happens, the path of least resistance for spot price remains sideways to lower, even if leveraged positioning continues to produce short-term volatility in both directions.
Outlook
The setup heading into the second half of July is fragile. Bitcoin overbought conditions on the 14-day RSI, combined with contracting spot volume and negative cumulative volume delta, suggest the rally could face sharp mean reversion if a fresh catalyst fails to materialize. Traders watching the 60,000-dollar level as the next support will be looking for spot volume to recover before trusting any further upside. Until then, Bitcoin’s price action looks more like a leveraged bounce than a true trend reversal, and the trust problem flagged by Glassnode is the most important signal in the market right now.